By the Numbers: Tight Seattle Real Estate Market Means Many Multiple Bid Situations
2012 looks like it’s going to be an interesting year in Seattle real estate. The Seattle real estate market is in an awkward teenage phase during its transition from constantly falling prices to what increasingly looks like price stability. Home owners still haven’t come to terms with their homes’ lower valuations, so they’re sitting on them, while home buyers still aren’t ready to offer more (although a few more weeks like the last one and I will no longer doubt the hunger of the home buyer).
We’ve heard a lot of chatter recently that the housing inventory in close to Seattle is crazy-tight. The word on the street is decent houses sell on the spot under an attack of bids by hungry buyers.
“Almost every listing is getting at least two offers.”
– Phil Leng quoted in Eric Pryne’s article earlier this week
We thought we’d crunch the numbers to see just how tight the Seattle market is. Note: data is accurate through March 8th, 2012.
The Claim: Multi-bid situations are up dramatically – especially in Seattle.
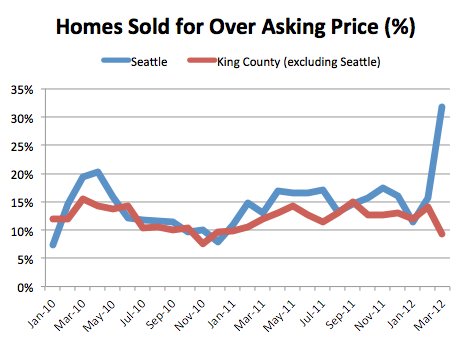
The Reality: Multibid situations are insanely up in Seattle in the first week of March. Of the 44 homes that closed in the first week of March, nearly 1 in 3 sold for above the original asking price. We don’t expect the rest of March to look like this, but if the percentage of homes sold above asking price in the rest of the month is cut in half, it would still be a record month:
Wow.
Full disclosure: January and February don’t look as phenomenal, but according to the agents we have spoken with, this trend really began in early February, meaning the closings are just starting now.
In February, about 16 houses in 100 sold for over the original list price. The percentage of homes selling for above the original asking price was up 6% year-over-year in February (from 15%to 16%) – well within the norm.
The last time the market was on fire was during the scramble leading up to the expiration of the first time home-buyer tax credit in 2010. Talk about higher highs! A whopping 20% of the homes sold in April 2010 sold for over list price. The resulting Snooki binge-worthy hangover lasted the rest of 2010.
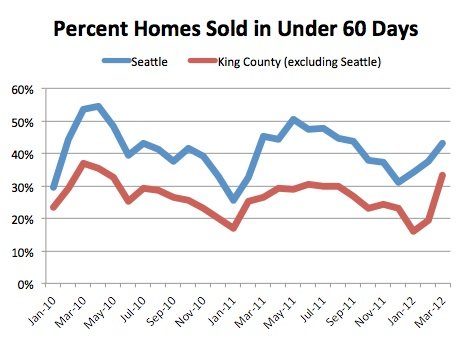
The Claim: More homes are flying off the shelves the moment they are listed
The Reality: This is more of a backwards looking stat, so it hasn’t caught up with the price increase trends. Homes are moving at about the same rate as they have been for the last two years. The percentage of homes selling within 60 days of being listed is up year-over-year, from 33 in 100 to 38 in 100, but we aren’t seeing the same speed-to-sale percentages we were seeing at the beginning of 2010. We suspect we’re going to see this number go up quite a bit through the rest of March and in early April.
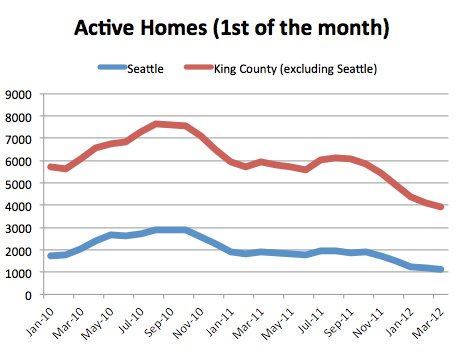
The Claim: There Very Few Homes On the Market
The Reality: True. The number of homes for sale in both King County and Seattle has plummeted over the last two years.
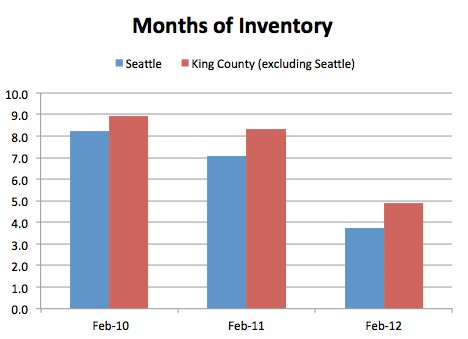
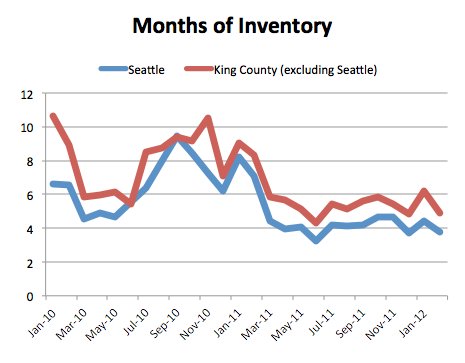
Another way of approaching this question is looking at the “months of inventory,” or the number of months at current sale rates that it would take to sell all the homes on the market. Both Seattle and King County are way below the February norm in 2012 – months of inventory is a whopping 44% lower in 2012 than it was in 2011:
Inventory of single family homes has been fairly low for the last year, but we typically expect a seasonal bump:
Like many, we expect 2012 will be the year we return to normal – and by normal we mean 1970s and 1980s normal, not 2000s – with home prices fairly flat. As a nation, we still have a lot of foreclosure inventory to work off, but in cities like Seattle or San Francisco, where stock option millionaires are being printed every day, we expect some real competition for mid-range homes.
That said, January and February are always slow months. Trying to predict whether home owners will list or sit on their homes for the rest of the year from the slow months is like trying to predict Christmas retail sales from March’s numbers – general directions are probably right, but a lot can change between now and then.
A few notes about our methodology:
- Stats were generated using data from the Northwest MLS – the same data we have on our Seattle real estate page
- We used single family homes for every report here and excluded townhouses from our dataset
- These stats not compiled, verified or published by The Northwest Multiple Listing Service